Self-Organizing Map example
Click the picture, please.
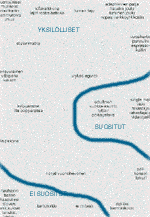
Figure: Map of potential Christmas presents organized by the SOM based on
the data
provided by Computing Paradigms participants on 24th of November
on their interests.
I edited the original eps file with Photoshop just a little
(not to be used in any serious context as such).
Command file (unix/linux, mlab)
randinit -din pjoulu3.dat -cout pjoulu.ini -topol hexa -neigh gaussian -xdim 4 -ydim 7
vsom -din pjoulu3.dat -cin pjoulu.ini -cout pjoulu.first.cod  -rlen 2000 -alpha 0.5 -radius 4
vsom -din pjoulu3.dat -cin pjoulu.first.cod -cout pjoulu.cod  -rlen 5000 -alpha 0.1 -radius 1
vcal -din pjoulu3.dat -cin pjoulu.cod -cout pjoulu.lab -numlabs 0
umat -cin pjoulu.lab -o pjoulu_umat3.eps -eps 1 -average 1 -fontsize 0.4 -W 0.5 -notitle -median
umat -cin pjoulu.lab -o pjoulu_umat3.ps -ps 1 -average 1 -fontsize 0.4 -W 0.5 -notitle -median
Command file with short explanations
Initializing the map
- din: input data file
- cout: initialized map
- topol: topology of the map (hexa or rect)
- neigh: neighborhood in the learning (gaussian or bubble) - just use either
- xdim: number of map nodes in x dimension
- ydim: number of map nodes in y dimension
randinit -din pjoulu3.dat -cout pjoulu.ini -topol hexa -neigh gaussian -xdim 4 -ydim 7
Teaching the map (in two phases: a) general order, b) refining)
- cin: input map (already initialized)
- rlen: length of the learning session
- alpha: how strong changes are made (0.0 - none, 1.0 - full, i.e., rapid but possible bad quality)
- radius: radius of the changes around the so called winner (quite large compared with the map size in the first round and 1 or 2 in the second) - don't neeed to bother in the first experiments if the settings are not much changed
vsom -din pjoulu3.dat -cin pjoulu.ini -cout pjoulu.first.cod -rlen 2000 -alpha 0.5 -radius 4
vsom -din pjoulu3.dat -cin pjoulu.first.cod -cout pjoulu.cod -rlen 5000 -alpha 0.1 -radius 1
Labeling the map
- numlabs: numlabs 0 says that a node is labeled by all corresponding
(best-matching) labels
vcal -din pjoulu3.dat -cin pjoulu.cod -cout pjoulu.lab -numlabs 0
Creating the map picture
umat -cin pjoulu.lab -o pjoulu_umat3.eps -eps 1 -average 1 -fontsize 0.4 -W 0.5 -notitle -median
umat -cin pjoulu.lab -o pjoulu_umat3.ps -ps 1 -average 1 -fontsize 0.4 -W 0.5 -notitle -median
More information: SOM_PAK documentation
(Self-Organizing Map Program Package, Kohonen, Hynninen, Kangas, Laaksonen)
The package itself can
also be downloaded (uniix or ms-dos). Note: already installed in
mlab.uiah.fi.
Data file
The first row gives the number of variables. All the following
rows are the actual data. Each data row consisted in this case
the opinion seven persons per an item plus the name of the item
in the end. The first column is thus the opinion of the first
person, etc. The number 5 meant "likes a lot" (even if already
has) and 1 meant "don't like at all".
7
1	2	1	2	5	2	3	suklaa
5	4	1	2	2	1	5	kylpyamme
1	1	1	5	1	1	1	nauhaton_basso
1	2	3	1	5	3	1	kermalikoori
3	2	5	5	3	5	4	adaptiivinen_patja
1	5	1	5	2	1	1	kaasuliesi
1	3	1	3	1	1	1	slov_lask.sukset
5	1	1	5	2	5	5	suom_murtsikat
1	5	5	3	4	5	1	single_malt_viski
2	3	3	1	1	1	1	norjal_vuonohevonen
2	4	5	3	3	5	3	vuosikertapunaviini
3	2	3	1	5	4	3	pelikonsoli
4	2	1	2	3	4	3	joensuul_villapaita
4	4	1	1	4	4	3	kiikarit
5	3	5	4	5	5	4	hauska_joulu
5	3	5	5	5	5	5	luminen_joulu
1	1	1	1	1	1	1	kettuturkki
1	1	3	3	3	2	1	ei_mitaan
1	4	1	2	1	1	1	tanskal_kinkku
3	4	2	1	5	5	5	etelanmatka
5	1	4	1	4	4	5	tofukalkkuna
5	2	1	5	2	4	5	riisinkeitin
3	4	1	2	1	2	1	leipakone
2	3	2	2	5	1	5	liukuri
1	4	5	5	2	3	5	espressokeitin
5	4	5	2	5	1	3	edull_vuokra-asunto
5	2	4	4	3	1	5	alykas_agentti
3	2	1	4	3	5	5	itseimuroiva_imuri
5	4	5	3	5	1	3	tytto/poikaystava
5	2	2	3	1	2	3	ilta_oopperassa
3	5	5	3	5	1	3	rakastaja/rakastajatar
5	5	5	5	5	5	5	nopea_verkkoyht_kotiin
3	5	5	1	5	3	5	videotykki
5	2	4	3	5	5	3	lumen_taju
5	1	5	1	3	5	5	lajitt_roskalaatikko
1	4	2	3	1	3	1	jouluhauki


Usage in mlab.uiah.fi

Save the commands above (or their modification) as, say, aja.run, and give:

./aja.run

in the directory in which you have the input data file.

Among the resulting files there is one eps and one ps map picture.


Timo Honkela