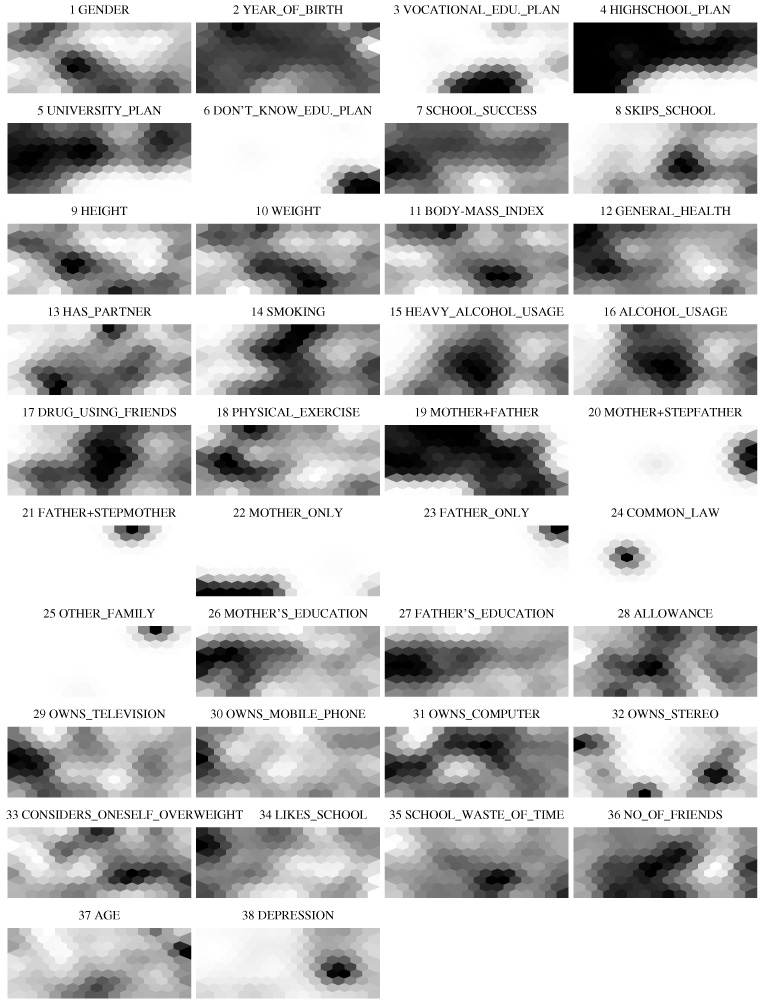
Self-organizing maps for data analysis - example
The example is taken from the article "Kohonen's Self-Organizing Maps in Contextual Analysis of Data" (publication details in the end of the page).
We display below a collection of variable planes based on an organized map. These variable planes illuminate the connections and correlations between the variables. For instance, the depressed persons (variable 38) in the material are concentrated in one area near the lower right corner of the map. A very similar distribution is discernable in the variable denoting the number of friends (36) with a negative correlation. The same prototypic cluster can also be found on the variable map for owning stereo equipment (32). There one can also find two other clusters. Thus, those depressed tend to have stereos but only some (visually, roughly one third) of those who have stereos are depressed.
Publication details: Honkela Timo, Koskinen Ilpo, Koskenniemi Timo and Karvonen Sakari: Kohonen's Self-Organizing Map in Contextual Analysis of Data. K. Tanaka, and S. Ghandeharizadeh (eds.), Information Organization and Databases: Foundations of Data Organization, Kluwer, 2000, pp. 135-148.