

An interactive timeline/production curve of oil production past and forecast. A data visualization
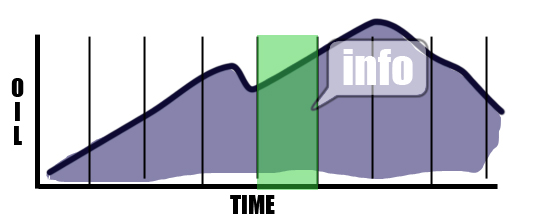
Part of dynamic visualization design 2 project. The project will be carried out using Flash / Flash builder. The final project will be a flash application intended for the web.
-
Authors
Tags
openFrameworks Links
Media and Data Resources
Other Links
- Adobe Flash Developer Center
- Arduino
- C4ios
- Cinder
- Cocos2D
- Corona SDK
- Flight 404 (Robert Hodgin, Cinder)
- Form+Code – code examples
- Kinect Hacks
- libpd
- Max/MSP/Jitter
- Multimedia Development (Flash)
- NodeBox
- OpenSceneGraph
- PhoneGap
- Pocode
- Pure Data
- Quartz Composer
- Software Studies (Processing, HTML5/JS)
- Sparrow Framework
- TestFlight
- TouchDesigner
- Unity
- vvvv
- Web Media Development (JavaScript)
- Xcode
Meta
Link to project files, including Mac app and multi-platform source code: http://mlab.taik.fi/mediacode/coursefiles/course_2011_04/projects/Lauri_Hassi/